
Ranking labs-of-origin for genetically engineered DNA using Metric Learning


With the constant advancements of genetic engineering, a common concern is to be able to identify the lab-of-origin of genetically engineered DNA sequences. For that reason, AltLabs has hosted the Genetic Engineering Attribution Challenge to gather many teams to propose new tools to solve this problem. Here we show our proposed method that aims to rank the most likely labs-of-origin and generate embeddings for DNA sequences and labs. These embeddings can also be used to perform various other tasks, like clustering both DNA sequences and labs and also using them as features for Machine Learning models applied to solve other problems. We will show that our method outperforms the classic training method for this task besides generating other useful information in addition to the lab-of-origin classification.
NOTE
This post is a preview of the paper we’ll be publishing on Arxiv about our participation in the Genetic Engineering Attribution Challenge.
Introduction
AltLabs hosted the Genetic Engineering Attribution Challenge [1], providing the participants with a dataset with 63,017 DNA sequences (with their phenotype characteristics) designed by 1,314 different labs. The goal was to design machine learning models to, given a DNA sequence, identify the most likely lab-of-origin. Since it is tough to predict the correct lab because they use similar design techniques, they decided to evaluate the solutions using top ten accuracy [2]. It means that the model needs to place the correct lab-of-origin within the ten most likely labs, according to the scores. It turns this problem into a ranking problem, instead of a simple classification, which might ask for different techniques.
We decided to create two branches during the competition. The first is a traditional approach using classification models (with a softmax to output probabilities for each lab). The second is the use of ranking models through Metric Learning [9] (more specifically, Triplet Networks [7]). This one has the goal of learning how to extract embeddings[1]. Humans cannot easily understand these features, but they are very useful for machine learning models.} (also known as feature vectors) from DNA sequences and, at the same time, learn the embeddings of the labs. A similarity measure (cosine similarity) is then applied to generate the score between a pair of a DNA sequence and a lab. This score, instead of trying to mimic a probability, describes how similar they are.
Despite the difference in how we train those two kinds of models, we designed them very similarly. Both of them shared the same preprocessing steps, and the first layers were almost the same. They diverged a little bit because some techniques worked better for classification and others for triplet learning. Nevertheless, the overall structure of these models was mostly the same. Even though they were very similar, our triplet networks consistently outperformed our classification models, indicating they are more suitable for ranking tasks.
Furthermore, it is not only about raw accuracy. Suppose a new sequence from an unknown lab goes through a regular classification model. In that case, it will probably attribute it to one of the known labs while giving no clue about its uncertainty. It is a known problem and has encouraged research in an area called Out-Of-Distribution Detection [3] [11]. On the other hand, our triplet network is more robust to this problem. The embedding extracted from such a sequence might differ significantly from all the labs’ embeddings, generating low similarity scores. This way, we could set a threshold and decide that it comes from an unknown lab if the score is below it.
Moreover, there is also an embedding learned for an unknown lab. We train the model to push it away from all the known labs. So, if the new sequence’s embedding is more similar to this one, we can also assume an out-of-distribution sequence. In summary, our proposed solution has a high accuracy while also dealing with new labs and providing embeddings for clustering and other tasks. We believe this will make it easier to identify new labs-of-origin.
Proposed Method
Our proposed method consists of different preprocessing techniques proved to be efficient for DNA sequences in our experiments, along with a Triplet Network. As a preprocessing step, we used Byte Pair Encoding (BPE) algorithm [4] to compress the DNA sequences. It works by looking for common patterns and unifying them into tokens, increasing the vocabulary while reducing the sequences’ size. It turned our vocabulary of 4 DNA bases into 1001 different tokens.
To deal with the fact that DNA sequences are circular, we used a circular shift data augmentation. This augmentation was used during training and inference, doing what is known as Test Time Augmentation. It means we feed the model with multiple versions of the same sequence (randomly circular shifted). We then take the average of the outputs. Further, to decrease the model’s complexity, we also limited the sequence to 1000 tokens. This operation runs after the circular shift, so the model receives different 1000 tokens sequences per execution and combines the results.
The model is composed of a Convolutional Neural Network with multiple kernels of different sizes, as proposed by Kim [8]. We use this base model to extract features from the sequence and concatenate them with the binary features provided in the dataset. We then pass it to a dense layer that will generate our sequence embedding. In parallel, we have an embedding layer that will learn the lab embeddings. For last, we use a cosine similarity measure between the embeddings to give us the final output.
We train this model as a Triplet Network. It is a Metric Learning technique commonly used for Face Recognition. It works by training with triplets of anchors, positives, and negatives. In a Face Recognition task, the anchor would be one picture of one person, the positive would be another picture of the same person, and the negative would be any picture of another person. The model learns to pull the anchor and positive together (making pictures of the same person produce similar embeddings) while pushing the negative away. In our case, the sequence is the anchor, while the positive is the source lab, and the negative is another lab. Our goal is to generate embeddings in which the sequences are close to their source lab and far from other labs and their sequences.
To generate these triplets, we use the dataset to provide us with the anchor (sequence) and positive (source lab). We then use a technique known as Hard Negative Mining [5] to select the negative (another lab). It means that instead of selecting a random lab as a negative example, we select the most challenging example. It would be the lab that is currently closer to our sequence in the latent space.
Results
During the competition, we tuned the classification model and triplet network to improve their performance. Our best triplet network got 90.39% top ten accuracy in the test dataset, while our best classification model got 89.36%. It shows that the triplet network performs better than a classification model in such a ranking task. Our final submission, which got 91.67% top ten accuracy in the test dataset and the 10th position in the competition, was an ensemble of triplet networks and classification models using Copeland’s Method [12].
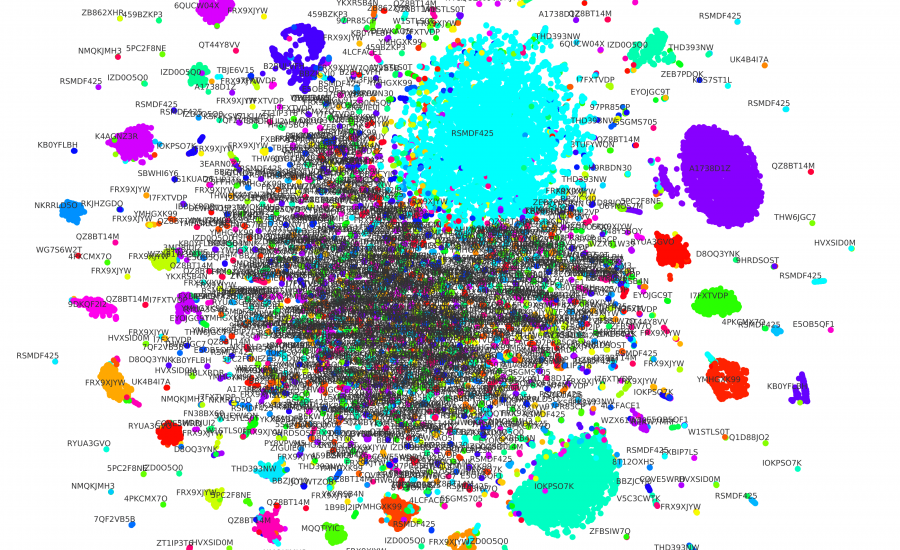
To showcase our triplet network utility, we used t-SNE [6] to reduce the embedding dimensionality from 200 to 2. This way, we can see how the same lab’s sequence embeddings are mostly clustered together in Figure 1. We can also see that there are many sequences very similar in the middle, even though they come from different labs. We theorize that they are from small labs that use similar techniques to create engineered DNA sequences. It is also worth noting that dimensionality reduction causes some losses, which might also explain it.
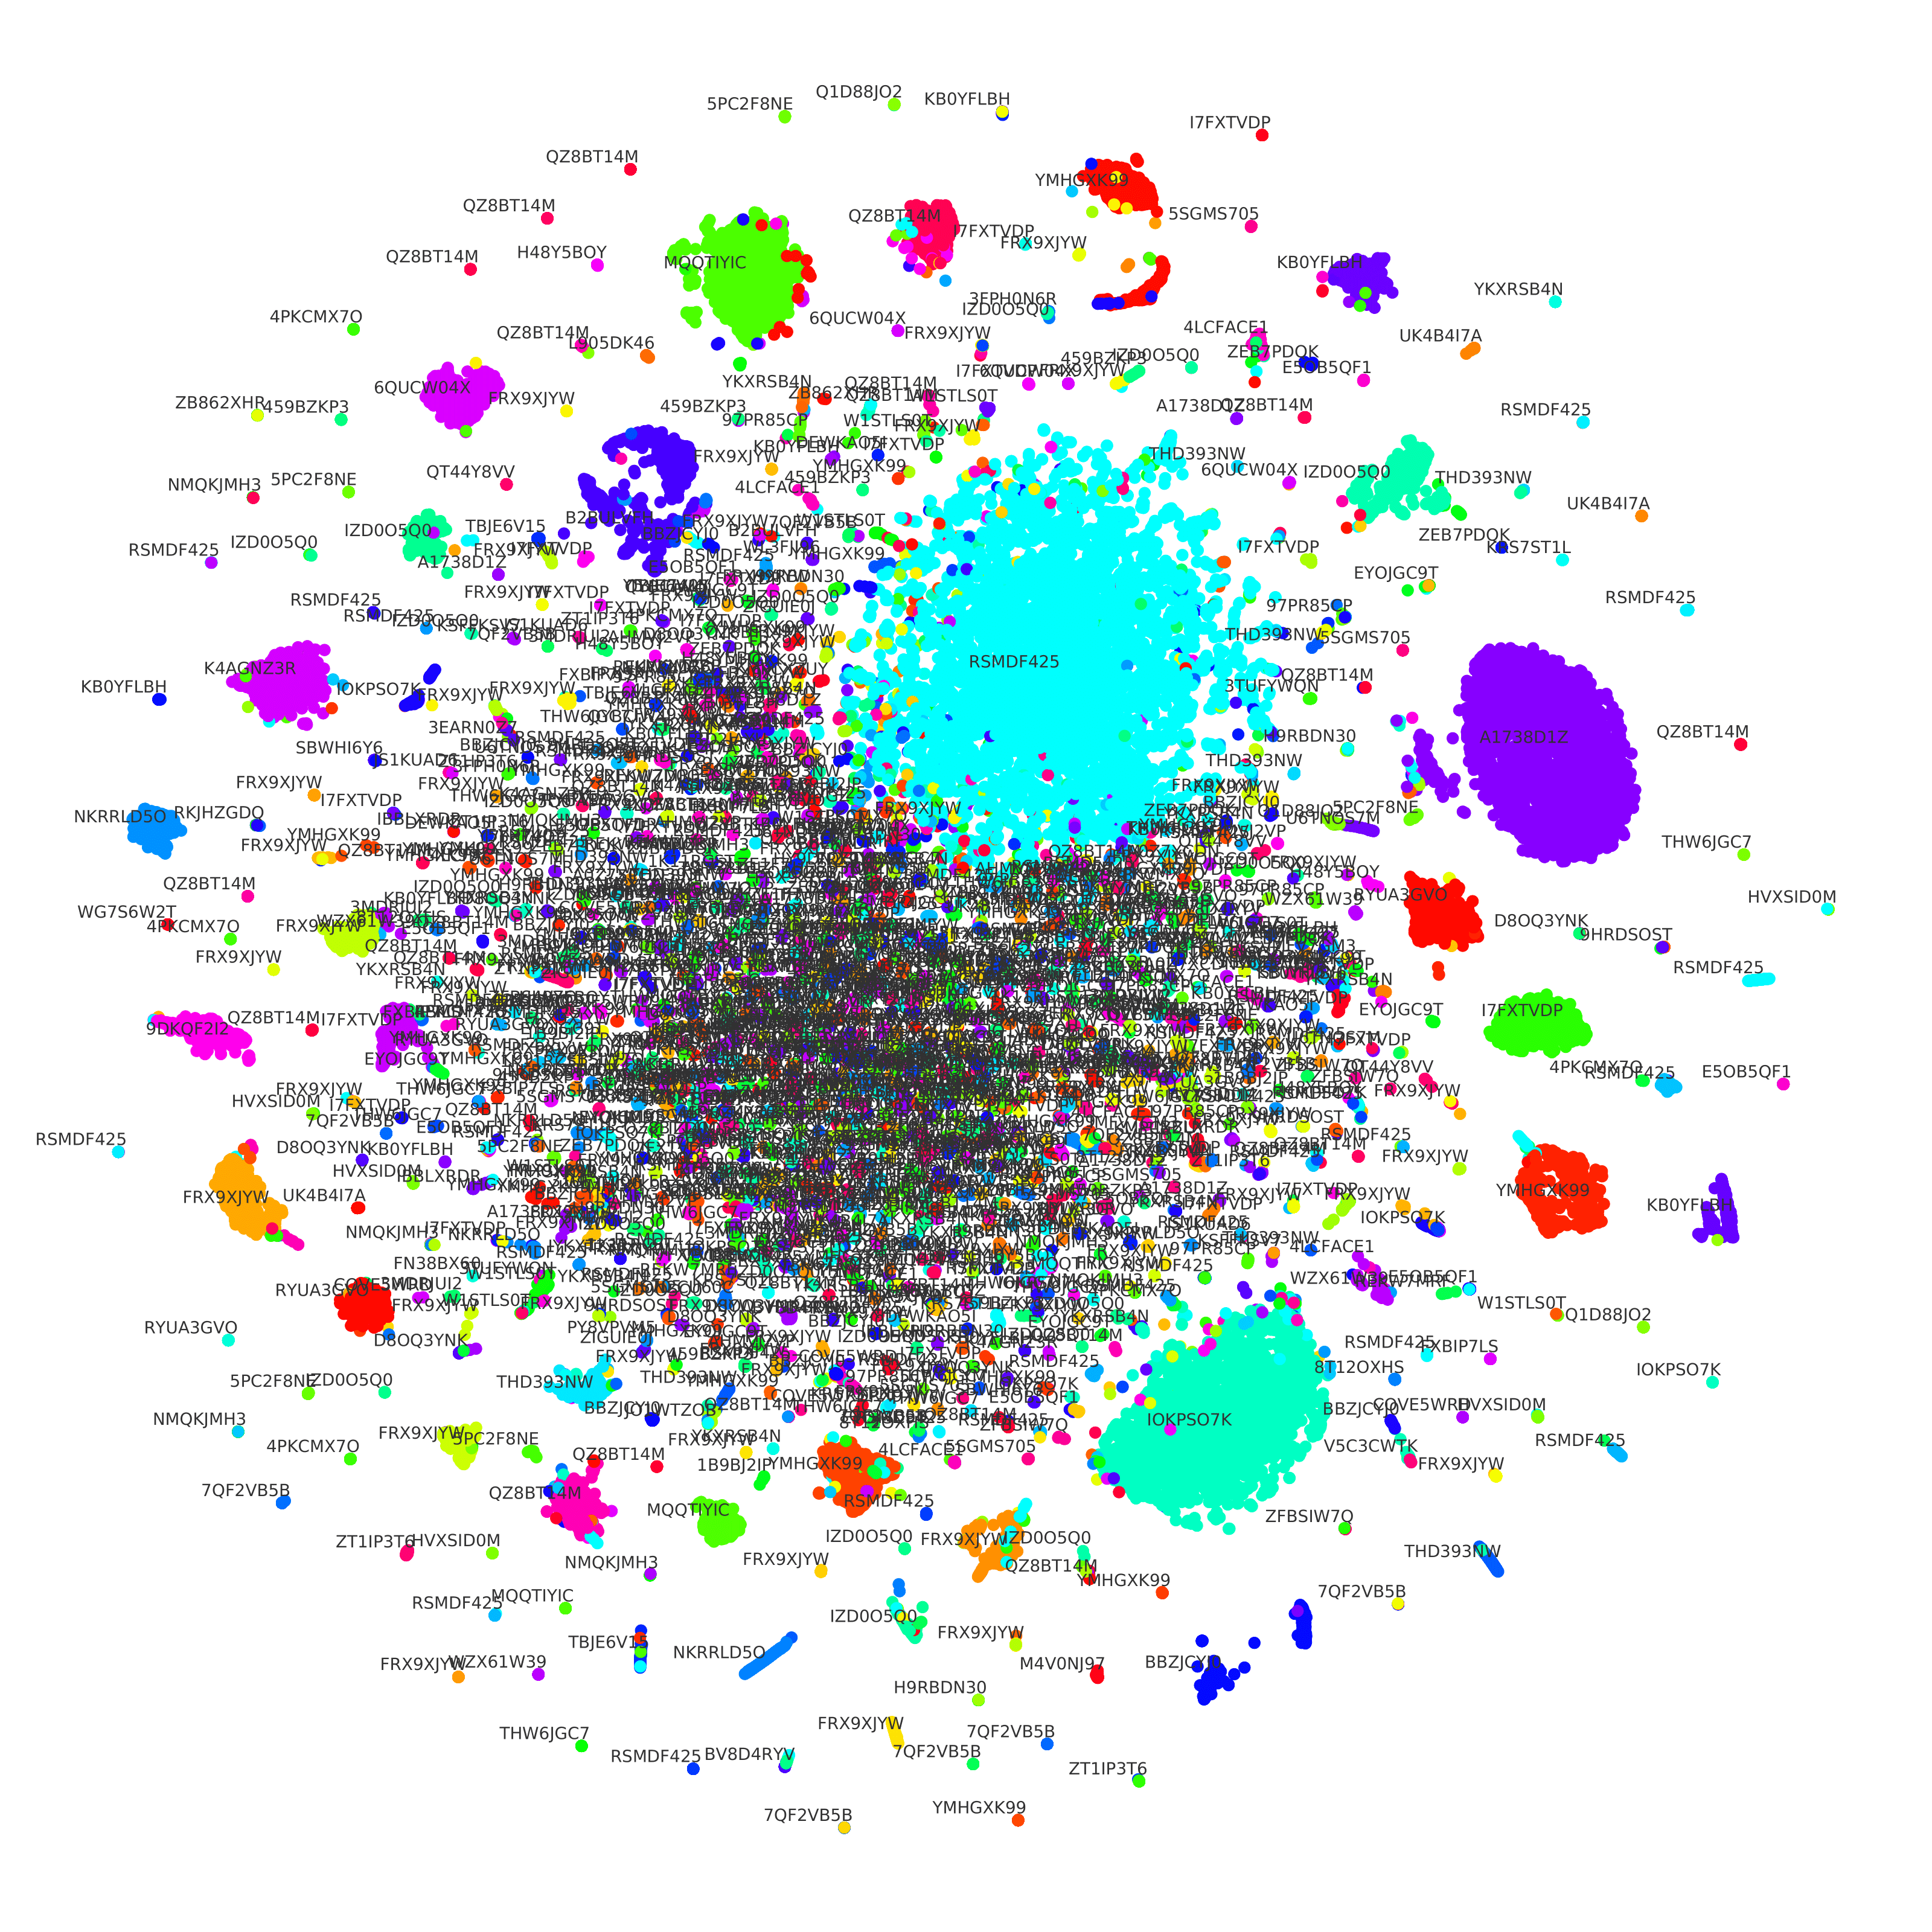
Figure 1: We used t-SNE to reduce the dimensionality of the embeddings of both sequences and labs. Each circle represents a DNA sequence, and the color shows the lab-of-origin of such sequence. We also print the text containing the ID of each lab.

We also applied K-Means [10] to cluster the lab embeddings. We then used the Elbow Method to indicate an optimal number of clusters. Our result is that we can cluster the 1,314 labs into nine groups. Such a small number of groups indicates that many labs are using similar techniques to engineer DNA sequences. Such clustering capabilities of our model could be instrumental in investigating the relationship between these labs.
Conclusions and Future Work
We showed that we could use Triplet Learning instead of a traditional Supervised Learning for classification. Moreover, it can outperform the traditional strategy while generating the embeddings as a by-product. We also showed some of such embeddings’ utility, like comparing different sequences and clustering sequences and labs..
We believe that a more advanced base model could be applied to extract features from the sequences for future work. New techniques like Transformers and Graph Convolutional Networks would be good candidates for this task. With better feature extraction, the embeddings would have higher quality, and the overall accuracy would also improve.
References
[1] [n.d.]. Genetic Engineering Attribution Challenge. https://www.drivendata.org/competitions/63/genetic-engineering-attribution/page/164/. Accessed: 2020-10-22.
[2] Ethan C. Alley, Miles Turpin, Andrew Bo Liu, Taylor Kulp-McDowall, Jacob Swett, Rey Edison, Stephen E. Von Stetina, George M. Church, and Kevin M. Esvelt. 2020. Attribution of genetic engineering: A practical and accurate machine-learning toolkit for biosecurity.bioRxiv(2020). https://doi.org/10.1101/2020.08.22.262576 arXiv:https://www.biorxiv.org/content/early/2020/08/22/2020.08.22.262576.full.pdf
[3] Jiefeng Chen, Yixuan Li, Xi Wu, Yingyu Liang, and Somesh Jha. 2020. Robust Out-of-distribution Detection for Neural Networks. arXiv:2003.09711 [cs.LG]
[4] Philip Gage. 1994. A New Algorithm for Data Compression. C Users J.12, 2 (Feb.1994), 23–38.
[5] Alexander Hermans, Lucas Beyer, and Bastian Leibe. 2017. In Defense of the Triplet Loss for Person Re-Identification. arXiv:1703.07737 [cs.CV]
[6] Geoffrey Hinton and Sam Roweis. 2002. Stochastic Neighbor Embedding. In Proceedings of the 15th International Conference on Neural Information Processing Systems (NIPS’02). MIT Press, Cambridge, MA, USA, 857–864.
[7] Elad Hoffer and Nir Ailon. 2018. Deep metric learning using Triplet network. arXiv:1412.6622 [cs.LG]
[8] Yoon Kim. 2014. Convolutional Neural Networks for Sentence Classification. arXiv:1408.5882 [cs.CL]
[9] Brian Kulis. 2013. Metric Learning: A Survey. Foundations and Trends® in Machine Learning 5, 4 (2013), 287–364. https://doi.org/10.1561/2200000019
[10] S. Lloyd. 1982. Least squares quantization in PCM. IEEE Transactions on Information Theory 28, 2 (1982), 129–137. https://doi.org/10.1109/TIT.1982.1056489
[11] Jie Ren, Peter J. Liu, Emily Fertig, Jasper Snoek, Ryan Poplin, Mark A. DePristo, Joshua V. Dillon, and Balaji Lakshminarayanan. 2019. Likelihood Ratios for Out-of-Distribution Detection. arXiv:1906.02845 [stat.ML]
[12] Donald G. Saari and Vincent R. Merlin. 1996. The Copeland method. Economic Theory 8, 1 (01 Feb 1996), 51–76. https://doi.org/10.1007/BF012120122020-10-23
-
Embedding is a vectorial representation of some entity. It compresses this entity into a vector in a way that each position represents a latent feature textbf{and its position is close to other entities with similar features in the same vector space ↩︎
THE BLOG
News, lessons, and content from our companies and projects.
41% of small businesses that employ people are operated by women.
We’ve been talking to several startups in the past two weeks! This is a curated list of the top 5 based on the analysis made by our models using the data we collected. This is as fresh as ...


Porto Seguro Challenge – 2nd Place Solution
We are pleased to announce that we got second place in the Porto Seguro Challenge, a competition organized by the largest insurance company in Brazil. Porto Seguro challenged us to build an ...
Adriano Marques
CEO at XNV
Predicting Reading Level of Texts – A Kaggle NLP Competition
Introduction: One of the main fields of AI is Natural Language Processing and its applications in the real world. Here on Amalgam.ai we are building different models to solve some of the problems ...
João Paulo Martins
Data Scientist XNV

Porto Seguro Challenge
Introduction: In the modern world the competition for marketing space is fierce, nowadays every company that wants the slight advantage needs AI to select the best customers and increase the ROI ...
João Paulo Martins
Data Scientist XNV
Sales Development Representative
At Exponential Ventures, we’re working to solve big problems with exponential technologies such as Artificial Intelligence, Quantum Computing, Digital Fabrication, Human-Machine ...

Rodolfo Egarter
COO @ Pluo

Exponential Hiring Process
The hiring process is a fundamental part of any company, it is the first contact of the professional with the culture and a great display of how things work internally. At Exponential Ventures it ...
Rodolfo Egarter
COO @ Pluo

Exponential Ventures annonce l’acquisition de PyJobs, FrontJobs et RecrutaDev
Fondé en 2017, PyJobs est devenu l’un des sites d’emploi les plus populaires du Brésil pour la communauté Python. Malgré sa croissance agressive au cours de la dernière année, ...
Adriano Marques
CEO at XNV

Exponential Ventures announces the acquisition of PyJobs, FrontJobs, and RecrutaDev
Founded in 2017, PyJobs has become one of Brazil’s most popular job boards for the Python community. Despite its aggressive growth in the past year, PyJobs retained its community-oriented ...
Adriano Marques
CEO at XNV

Sales Executive
At Exponential Ventures, we’re working to solve big problems with exponential technologies such as Artificial Intelligence, Quantum Computing, Digital Fabrication, Human-Machine ...
Rodolfo Egarter
COO @ Pluo

What is a Startup Studio?
Spoiler: it is NOT an Incubator or Accelerator I have probably interviewed a few hundred professionals in my career as an Entrepreneur. After breaking the ice, one of the first things I do is ask ...
Adriano Marques
CEO at XNV

Social Media
At Exponential Ventures, we’re working to solve big problems with exponential technologies such as Artificial Intelligence, Quantum Computing, Digital Fabrication, Human-Machine ...
Rodolfo Egarter
COO @ Pluo

Hunting for Unicorns
Everybody loves unicorns, right? But perhaps no one loves them more than tech companies. When hiring for a professional, we have an ideal vision of who we are looking for. A professional with X ...
Rodolfo Egarter
COO @ Pluo
Stay In The Loop!
Receive updates and news about XNV and our child companies. Don't worry, we don't SPAM. Ever.
